Dashboard Overview
The dashboard is the first screen you see after logging in to the SALT management server. It provides an at-a-glance summary of data collection activity.
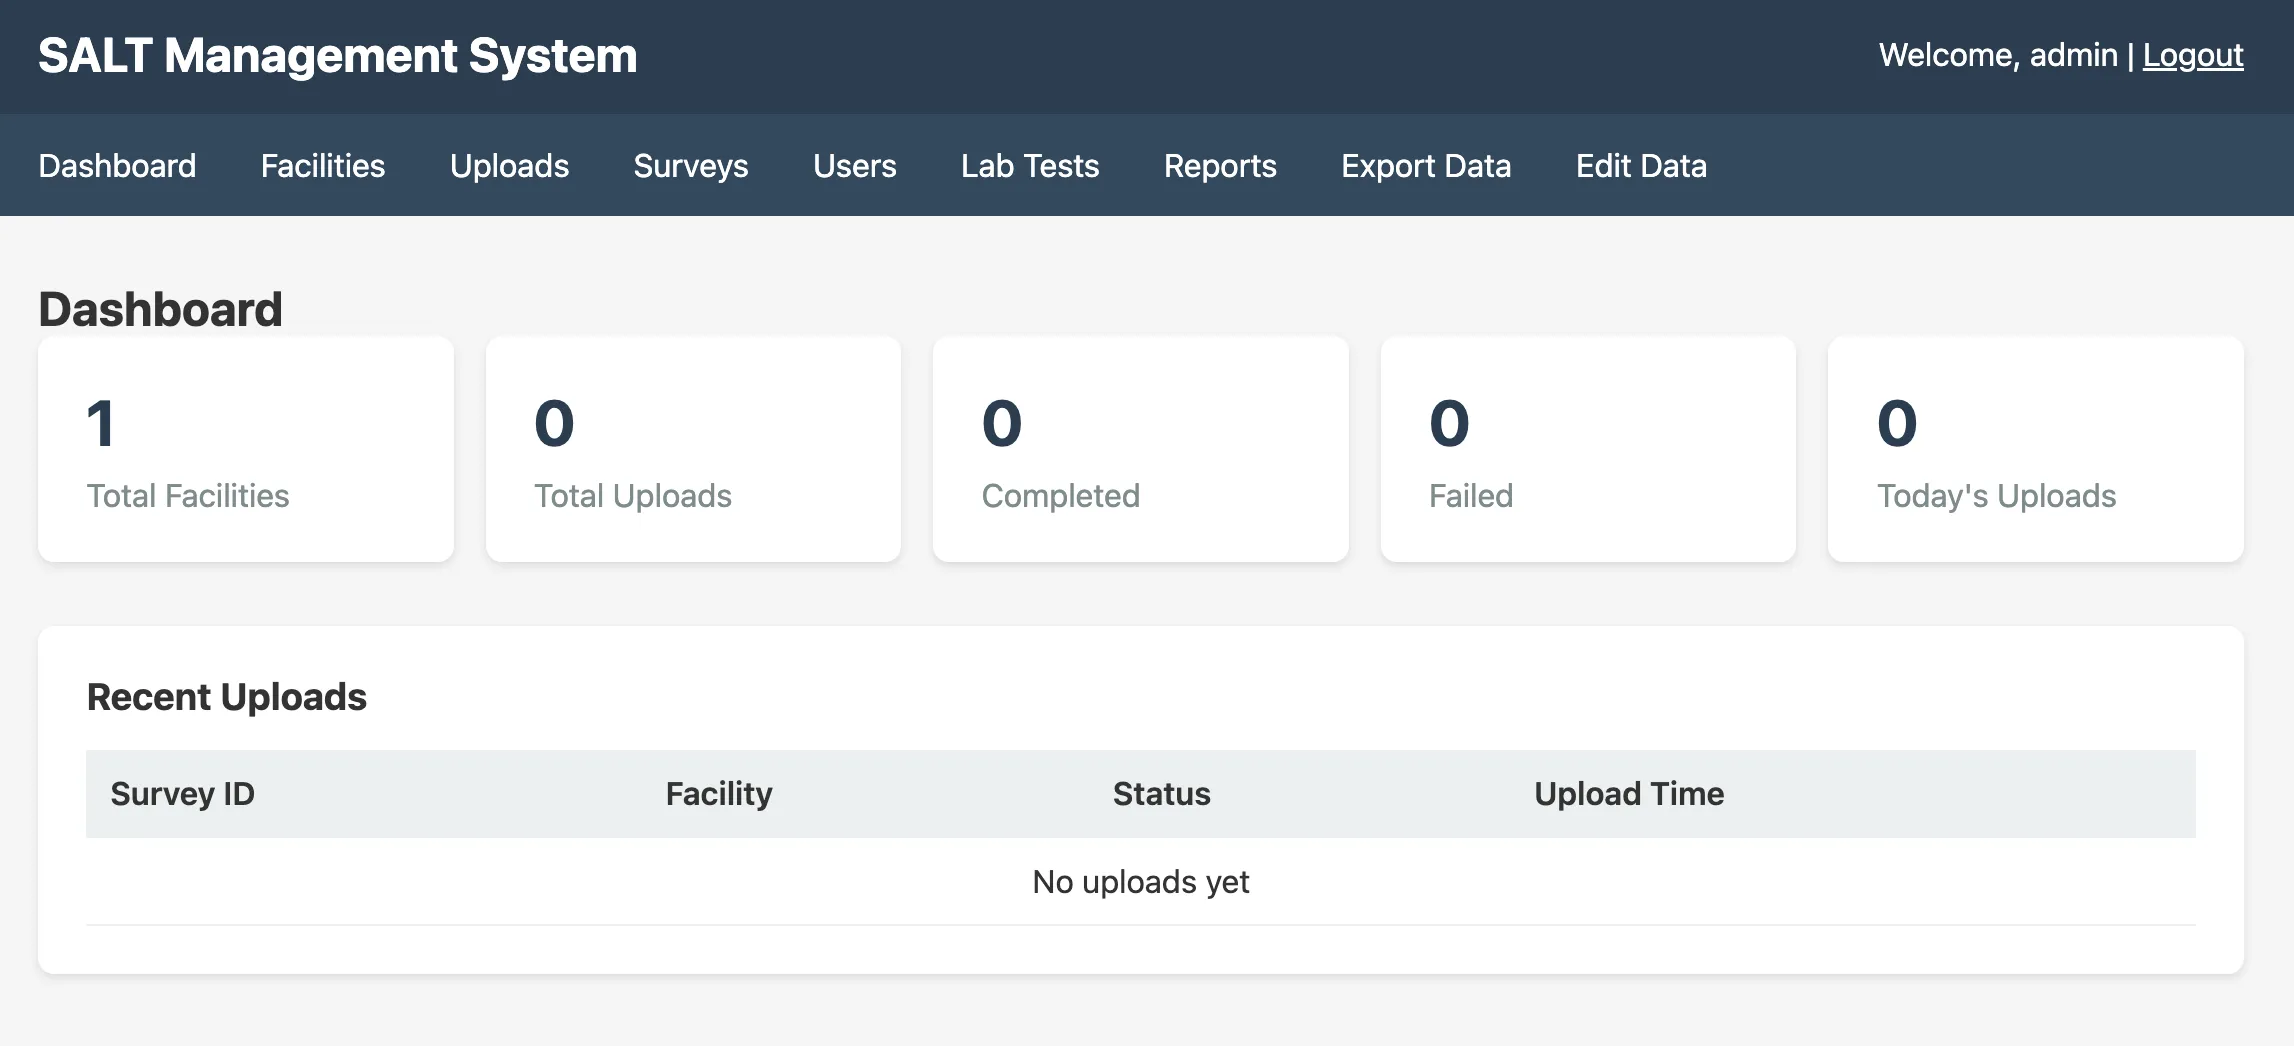
Summary statistics
| Metric | Description |
|---|---|
| Total Facilities | Number of registered facilities |
| Total Uploads | All survey uploads ever received |
| Completed | Uploads that passed validation and were stored successfully |
| Failed | Uploads that were rejected due to validation errors |
| Today’s Uploads | Uploads received in the current calendar day |
Recent Uploads table
Below the summary statistics, a table lists the most recent survey uploads with:
- Survey ID: internal identifier of the survey definition
- Facility: the facility that submitted the upload
- Participant ID: the unique participant identifier assigned by the tablet
- Status:
completedorfailed - Upload Time: server timestamp of when the upload was received
Clicking a row opens the upload detail view (if available).
Navigation
The left sidebar provides access to all management sections:
- Facilities: manage participating sites
- Uploads: full upload history and error details
- Surveys: survey builder and configuration
- Users: manage administrator accounts
- Lab Tests: configure and enter laboratory results
- Reports: create and schedule analytical reports
- Export Data: download survey data
- Edit Data: soft-delete subjects or correct individual responses